QUALCOMM Incorporated (QCOM) Dividend History
QUALCOMM Incorporated Last Dividend Date
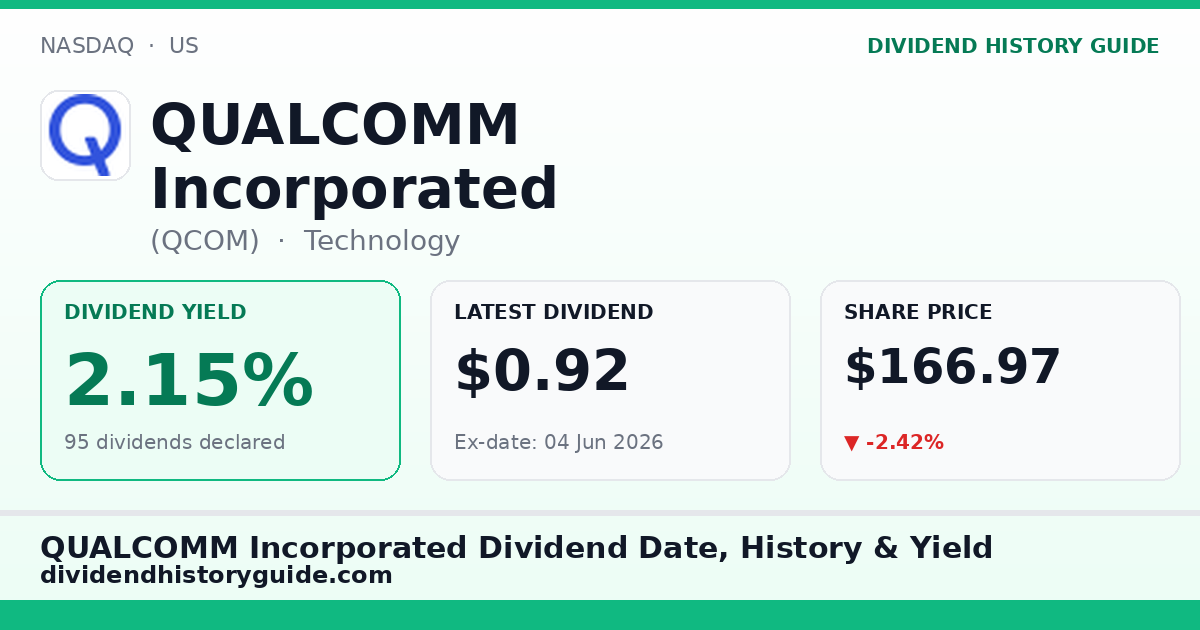
Last Ex-Date: June 04, 2026 — $0.92 (REGULAR)
QUALCOMM Incorporated Dividend Overview
Dividend Yield
2.15%
12M Total Dividend
$3.59
Total Declared
95
Payout Ratio
38.3%
QUALCOMM Incorporated Share Price — 1 Year History
▲ 7.6% (1Y)QUALCOMM Incorporated Annual Dividend Trend
Complete QUALCOMM Incorporated Dividend History
All 95 dividend payments by QUALCOMM Incorporated
| Ex-Date | Amount ($) | Type | Record Date |
|---|---|---|---|
| 04 Jun 2026 | 0.92 | REGULAR | -- |
| 05 Mar 2026 | 0.89 | REGULAR | -- |
| 04 Dec 2025 | 0.89 | REGULAR | -- |
| 04 Sep 2025 | 0.89 | REGULAR | -- |
| 05 Jun 2025 | 0.89 | REGULAR | -- |
| 06 Mar 2025 | 0.85 | REGULAR | -- |
| 05 Dec 2024 | 0.85 | REGULAR | -- |
| 05 Sep 2024 | 0.85 | REGULAR | -- |
| 30 May 2024 | 0.85 | REGULAR | -- |
| 28 Feb 2024 | 0.80 | REGULAR | -- |
| 29 Nov 2023 | 0.80 | REGULAR | -- |
| 30 Aug 2023 | 0.80 | REGULAR | -- |
| 31 May 2023 | 0.80 | REGULAR | -- |
| 01 Mar 2023 | 0.75 | REGULAR | -- |
| 30 Nov 2022 | 0.75 | REGULAR | -- |
| 31 Aug 2022 | 0.75 | REGULAR | -- |
| 01 Jun 2022 | 0.75 | REGULAR | -- |
| 02 Mar 2022 | 0.68 | REGULAR | -- |
| 01 Dec 2021 | 0.68 | REGULAR | -- |
| 01 Sep 2021 | 0.68 | REGULAR | -- |
| 02 Jun 2021 | 0.68 | REGULAR | -- |
| 03 Mar 2021 | 0.65 | REGULAR | -- |
| 02 Dec 2020 | 0.65 | REGULAR | -- |
| 02 Sep 2020 | 0.65 | REGULAR | -- |
| 03 Jun 2020 | 0.65 | REGULAR | -- |
| 04 Mar 2020 | 0.62 | REGULAR | -- |
| 04 Dec 2019 | 0.62 | REGULAR | -- |
| 11 Sep 2019 | 0.62 | REGULAR | -- |
| 05 Jun 2019 | 0.62 | REGULAR | -- |
| 06 Mar 2019 | 0.62 | REGULAR | -- |
| 06 Dec 2018 | 0.62 | REGULAR | -- |
| 04 Sep 2018 | 0.62 | REGULAR | -- |
| 29 May 2018 | 0.62 | REGULAR | -- |
| 27 Feb 2018 | 0.57 | REGULAR | -- |
| 28 Nov 2017 | 0.57 | REGULAR | -- |
| 28 Aug 2017 | 0.57 | REGULAR | -- |
| 26 May 2017 | 0.57 | REGULAR | -- |
| 27 Feb 2017 | 0.53 | REGULAR | -- |
| 28 Nov 2016 | 0.53 | REGULAR | -- |
| 29 Aug 2016 | 0.53 | REGULAR | -- |
| 27 May 2016 | 0.53 | REGULAR | -- |
| 29 Feb 2016 | 0.48 | REGULAR | -- |
| 27 Nov 2015 | 0.48 | REGULAR | -- |
| 31 Aug 2015 | 0.48 | REGULAR | -- |
| 01 Jun 2015 | 0.48 | REGULAR | -- |
| 02 Mar 2015 | 0.42 | REGULAR | -- |
| 26 Nov 2014 | 0.42 | REGULAR | -- |
| 29 Aug 2014 | 0.42 | REGULAR | -- |
| 02 Jun 2014 | 0.42 | REGULAR | -- |
| 03 Mar 2014 | 0.35 | REGULAR | -- |
| 27 Nov 2013 | 0.35 | REGULAR | -- |
| 30 Aug 2013 | 0.35 | REGULAR | -- |
| 03 Jun 2013 | 0.35 | REGULAR | -- |
| 06 Mar 2013 | 0.25 | REGULAR | -- |
| 05 Dec 2012 | 0.25 | REGULAR | -- |
| 05 Sep 2012 | 0.25 | REGULAR | -- |
| 30 May 2012 | 0.25 | REGULAR | -- |
| 29 Feb 2012 | 0.21 | REGULAR | -- |
| 21 Nov 2011 | 0.21 | REGULAR | -- |
| 24 Aug 2011 | 0.21 | REGULAR | -- |
| 25 May 2011 | 0.21 | REGULAR | -- |
| 23 Feb 2011 | 0.19 | REGULAR | -- |
| 22 Nov 2010 | 0.19 | REGULAR | -- |
| 25 Aug 2010 | 0.19 | REGULAR | -- |
| 26 May 2010 | 0.19 | REGULAR | -- |
| 24 Feb 2010 | 0.17 | REGULAR | -- |
| 23 Nov 2009 | 0.17 | REGULAR | -- |
| 26 Aug 2009 | 0.17 | REGULAR | -- |
| 27 May 2009 | 0.17 | REGULAR | -- |
| 25 Feb 2009 | 0.16 | REGULAR | -- |
| 09 Dec 2008 | 0.16 | REGULAR | -- |
| 27 Aug 2008 | 0.16 | REGULAR | -- |
| 28 May 2008 | 0.16 | REGULAR | -- |
| 27 Feb 2008 | 0.14 | REGULAR | -- |
| 05 Dec 2007 | 0.14 | REGULAR | -- |
| 29 Aug 2007 | 0.14 | REGULAR | -- |
| 30 May 2007 | 0.14 | REGULAR | -- |
| 28 Feb 2007 | 0.12 | REGULAR | -- |
| 05 Dec 2006 | 0.12 | REGULAR | -- |
| 23 Aug 2006 | 0.12 | REGULAR | -- |
| 24 May 2006 | 0.12 | REGULAR | -- |
| 22 Feb 2006 | 0.09 | REGULAR | -- |
| 05 Dec 2005 | 0.09 | REGULAR | -- |
| 24 Aug 2005 | 0.09 | REGULAR | -- |
| 25 May 2005 | 0.09 | REGULAR | -- |
| 23 Feb 2005 | 0.07 | REGULAR | -- |
| 06 Dec 2004 | 0.07 | REGULAR | -- |
| 25 Aug 2004 | 0.07 | REGULAR | -- |
| 26 May 2004 | 0.05 | REGULAR | -- |
| 25 Feb 2004 | 0.04 | REGULAR | -- |
| 25 Nov 2003 | 0.04 | REGULAR | -- |
| 27 Aug 2003 | 0.04 | REGULAR | -- |
| 28 May 2003 | 0.03 | REGULAR | -- |
| 12 Mar 2003 | 0.03 | REGULAR | -- |
| 24 Sep 1998 | 0.07 | REGULAR | -- |
QUALCOMM Incorporated Analyst Recommendations
Strong Buy
Buy
Hold
Sell
Strong Sell
QUALCOMM Incorporated Dividend FAQ
What is QUALCOMM Incorporated dividend date 2026?
The last QUALCOMM Incorporated ex-dividend date was June 04, 2026 ($0.92 per share). The next dividend date has not been announced yet. QUALCOMM Incorporated typically pays annual dividends.
What is QUALCOMM Incorporated (QCOM) current dividend yield?
QUALCOMM Incorporated has a current dividend yield of 2.15%. The 12-month dividend is $3.59 per share at a share price of $166.97.
How many dividends has QUALCOMM Incorporated declared?
QUALCOMM Incorporated has declared a total of 95 dividends. The highest single dividend was $0.92 per share.
When is the next QUALCOMM Incorporated ex-dividend date?
The last QUALCOMM Incorporated ex-dividend date was June 04, 2026 ($0.92 per share). The next dividend date has not been announced yet. QUALCOMM Incorporated typically pays annual dividends.
What is the face value of QUALCOMM Incorporated shares?
The face value of QUALCOMM Incorporated (QCOM) shares is $None.
Is QUALCOMM Incorporated a good dividend stock?
QUALCOMM Incorporated has declared 95 dividends with a current yield of 2.15%. The 5-year average yield is 1.87%, suggesting stable payouts. Investors should consider dividend consistency, payout ratio, and the P/E ratio of 17.9 before investing.
How to buy QUALCOMM Incorporated shares to get dividend?
To receive QUALCOMM Incorporated dividends, you must buy shares at least one business day before the ex-dividend date. Shares purchased on or after the ex-date are not eligible for that dividend. You can buy QUALCOMM Incorporated (QCOM) through any registered stockbroker.
What is QUALCOMM Incorporated highest dividend per share?
The highest single dividend paid by QUALCOMM Incorporated was $0.92 per share. The total dividend paid to date is $39.585300000000004.
QUALCOMM Incorporated Quick Info
$166.97
-4.14 (-2.42%)
- Exchange
- NASDAQ
- Symbol
- QCOM
- Sector
- Technology
- Industry
- Semiconductors
- P/E Ratio
- 17.95
- Market Cap
- $175.99B
- Book Value
- $25.76
- EPS
- $9.30
- 52W Range
- $122 - $260
- 5Y Avg Yield
- 1.87%
- Highest Dividend
- $0.92
- Total Paid
- $39.59
- Listed in
- Highest Dividend Yield Stocks
- Listed in
- Dividend Stocks Under Rs.500
Stocks Similar to QUALCOMM Incorporated
IB
International Business Machines Corporation Dividend History
IBM • 3.1% yield
RT
Roper Technologies, Inc. Dividend History
ROP • 1.0% yield
AD
Automatic Data Processing, Inc. Dividend History
ADP • 2.7% yield
CS
Cisco Systems, Inc. Dividend History
CSCO • 1.4% yield